

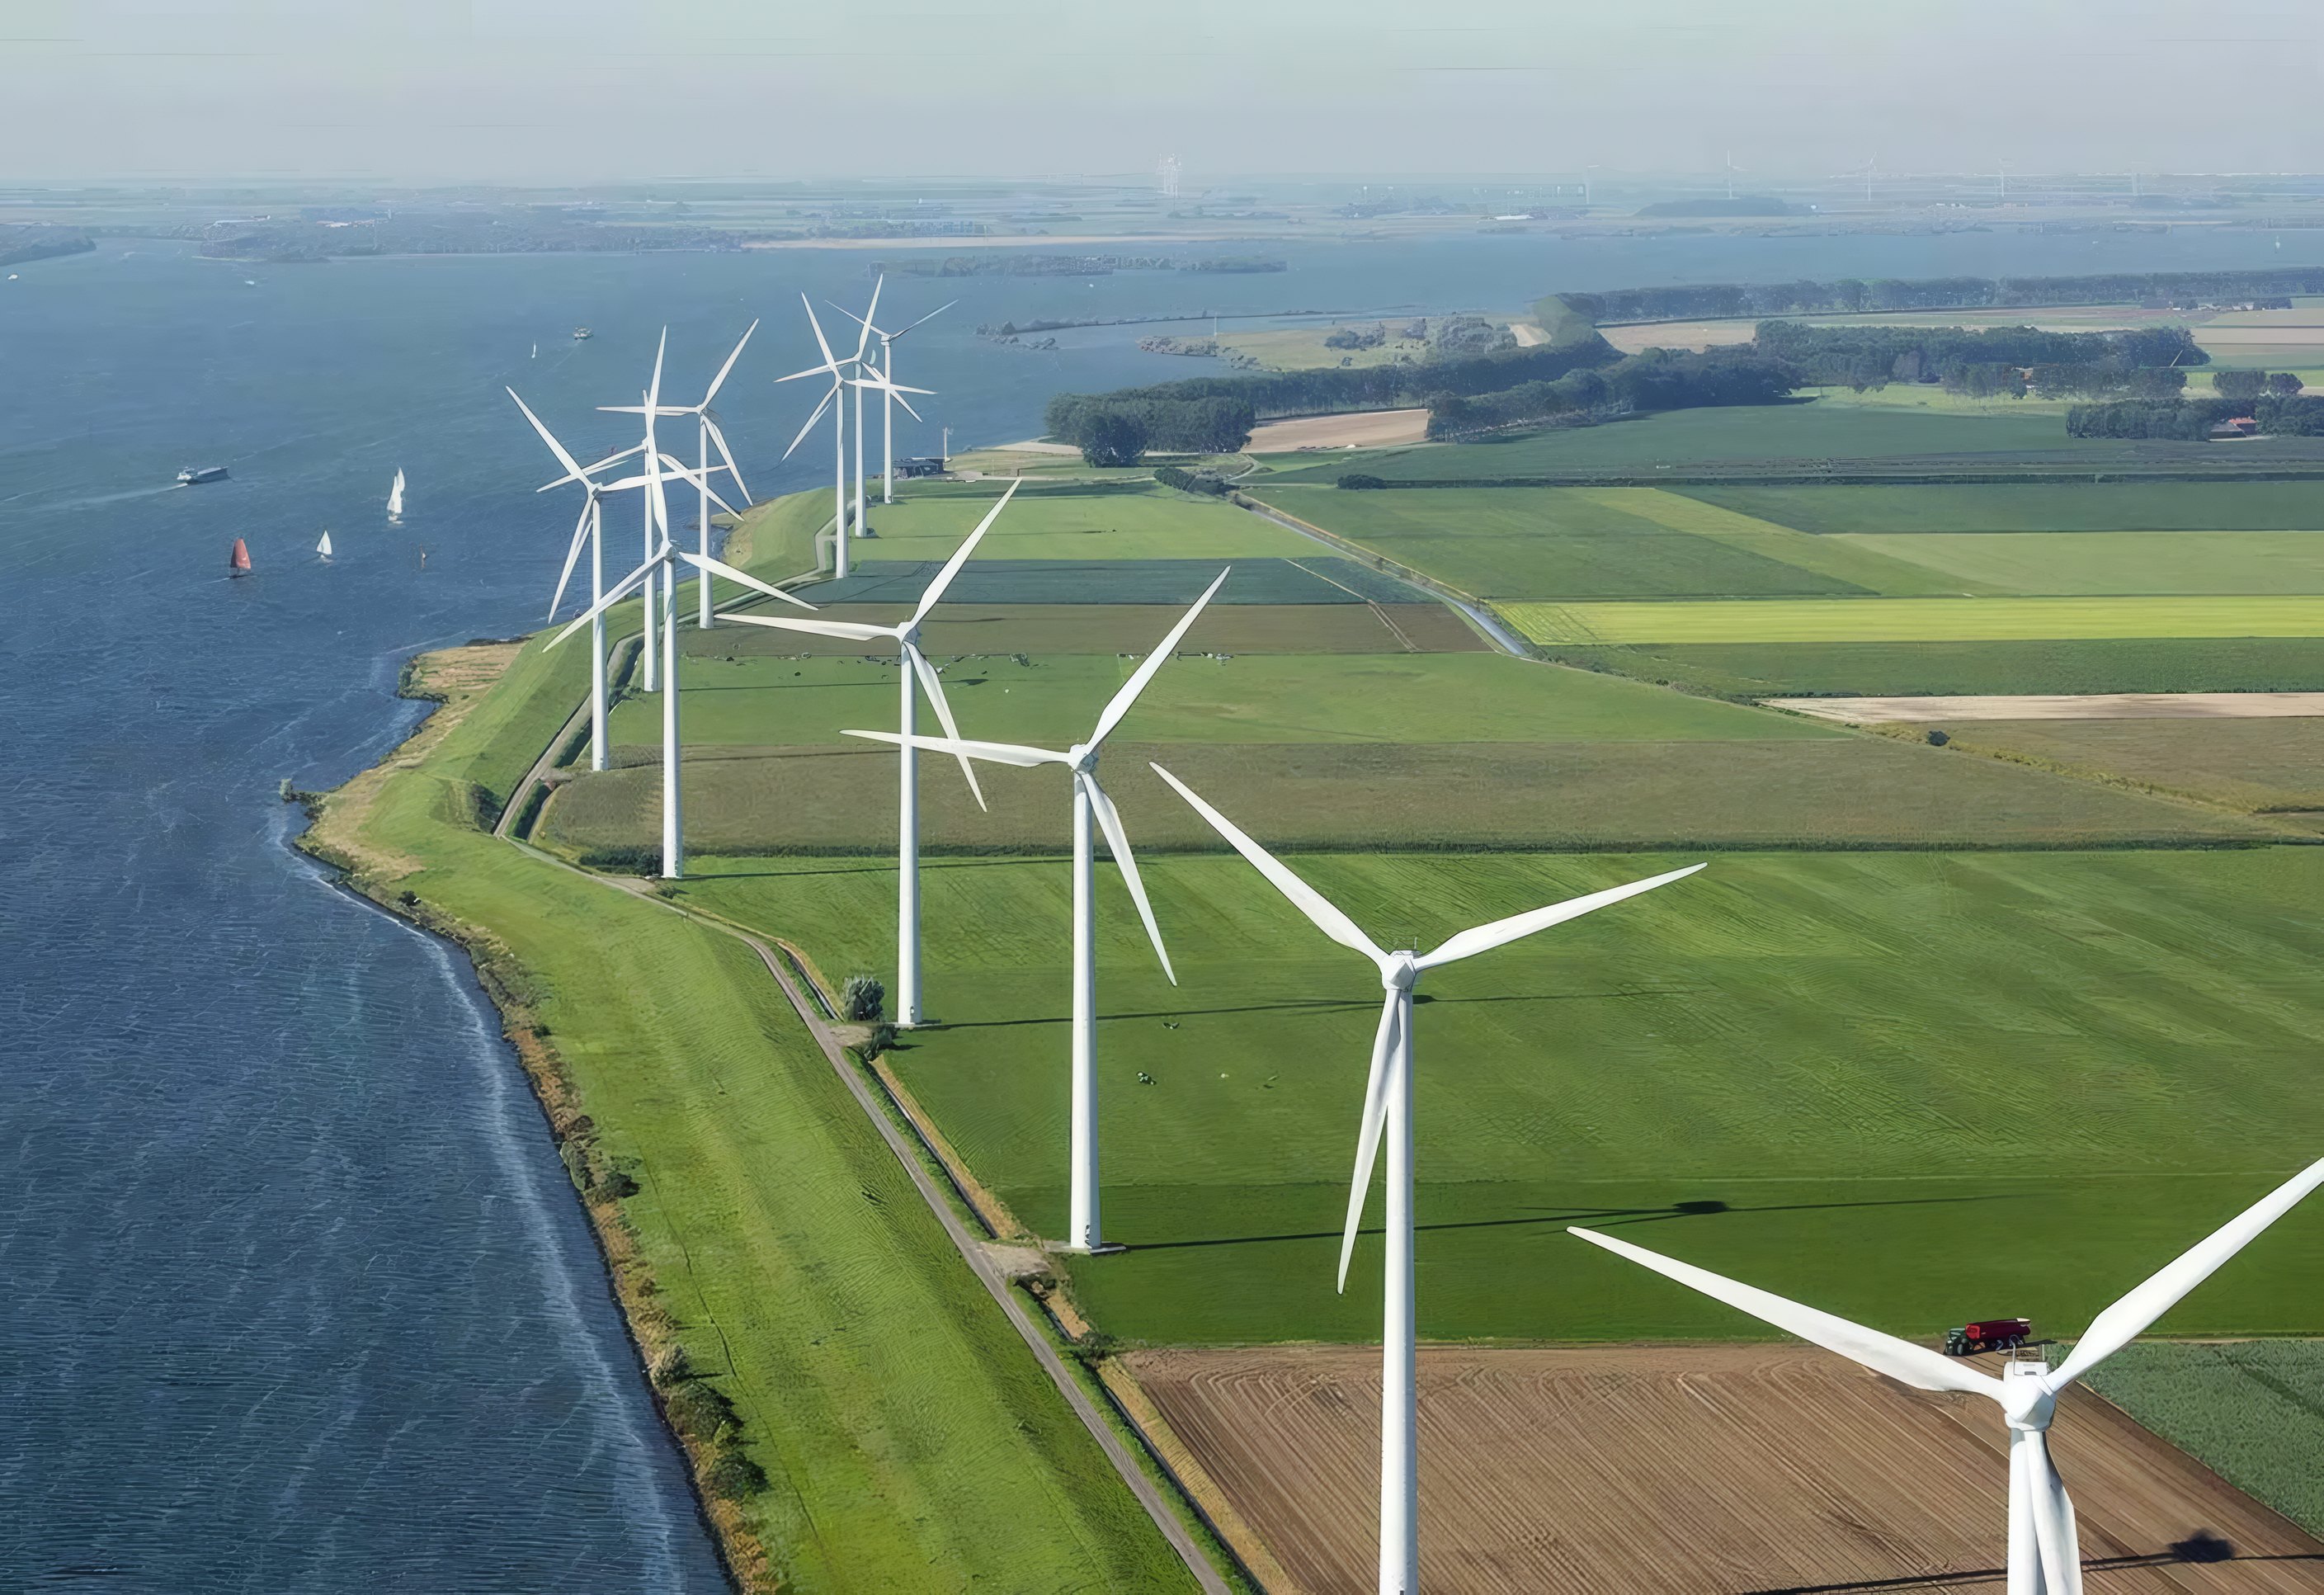

 14.0% output
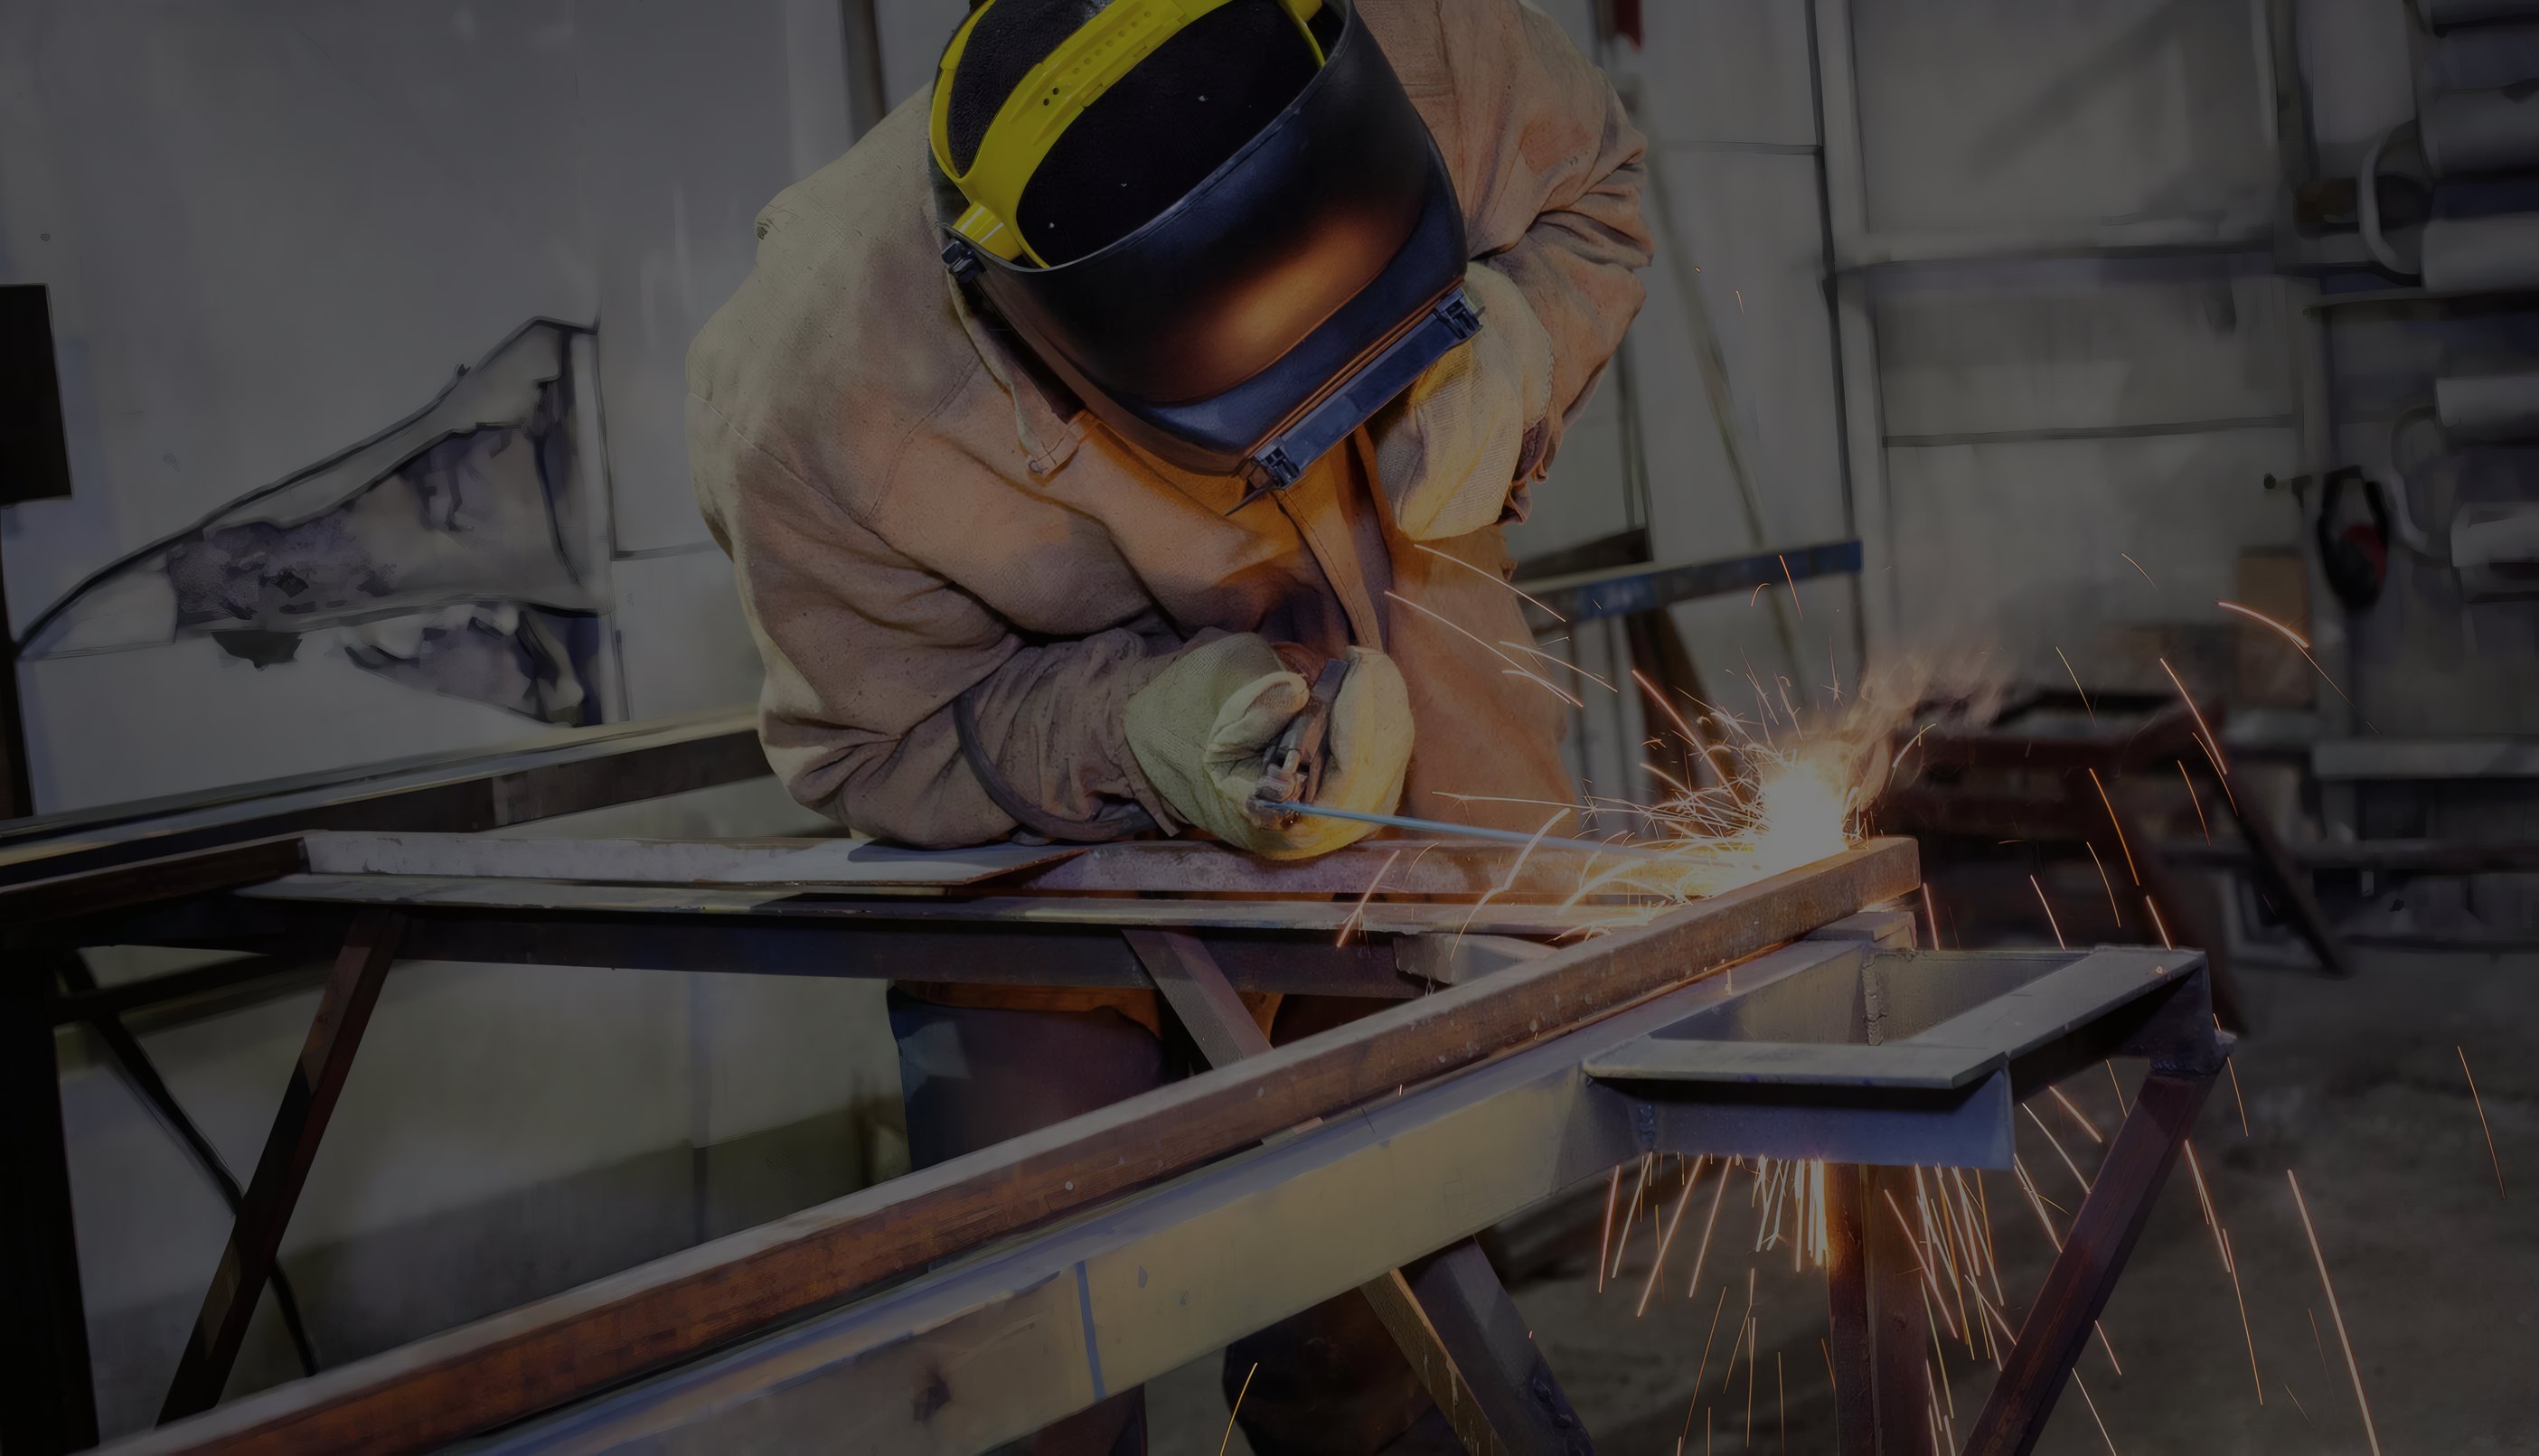
An Industrial Group Since 1962
StrengthenThe Enterprise
Four divisions - agriculture, energy, logistics and manufacturing - owned and run for the long term since 1962.
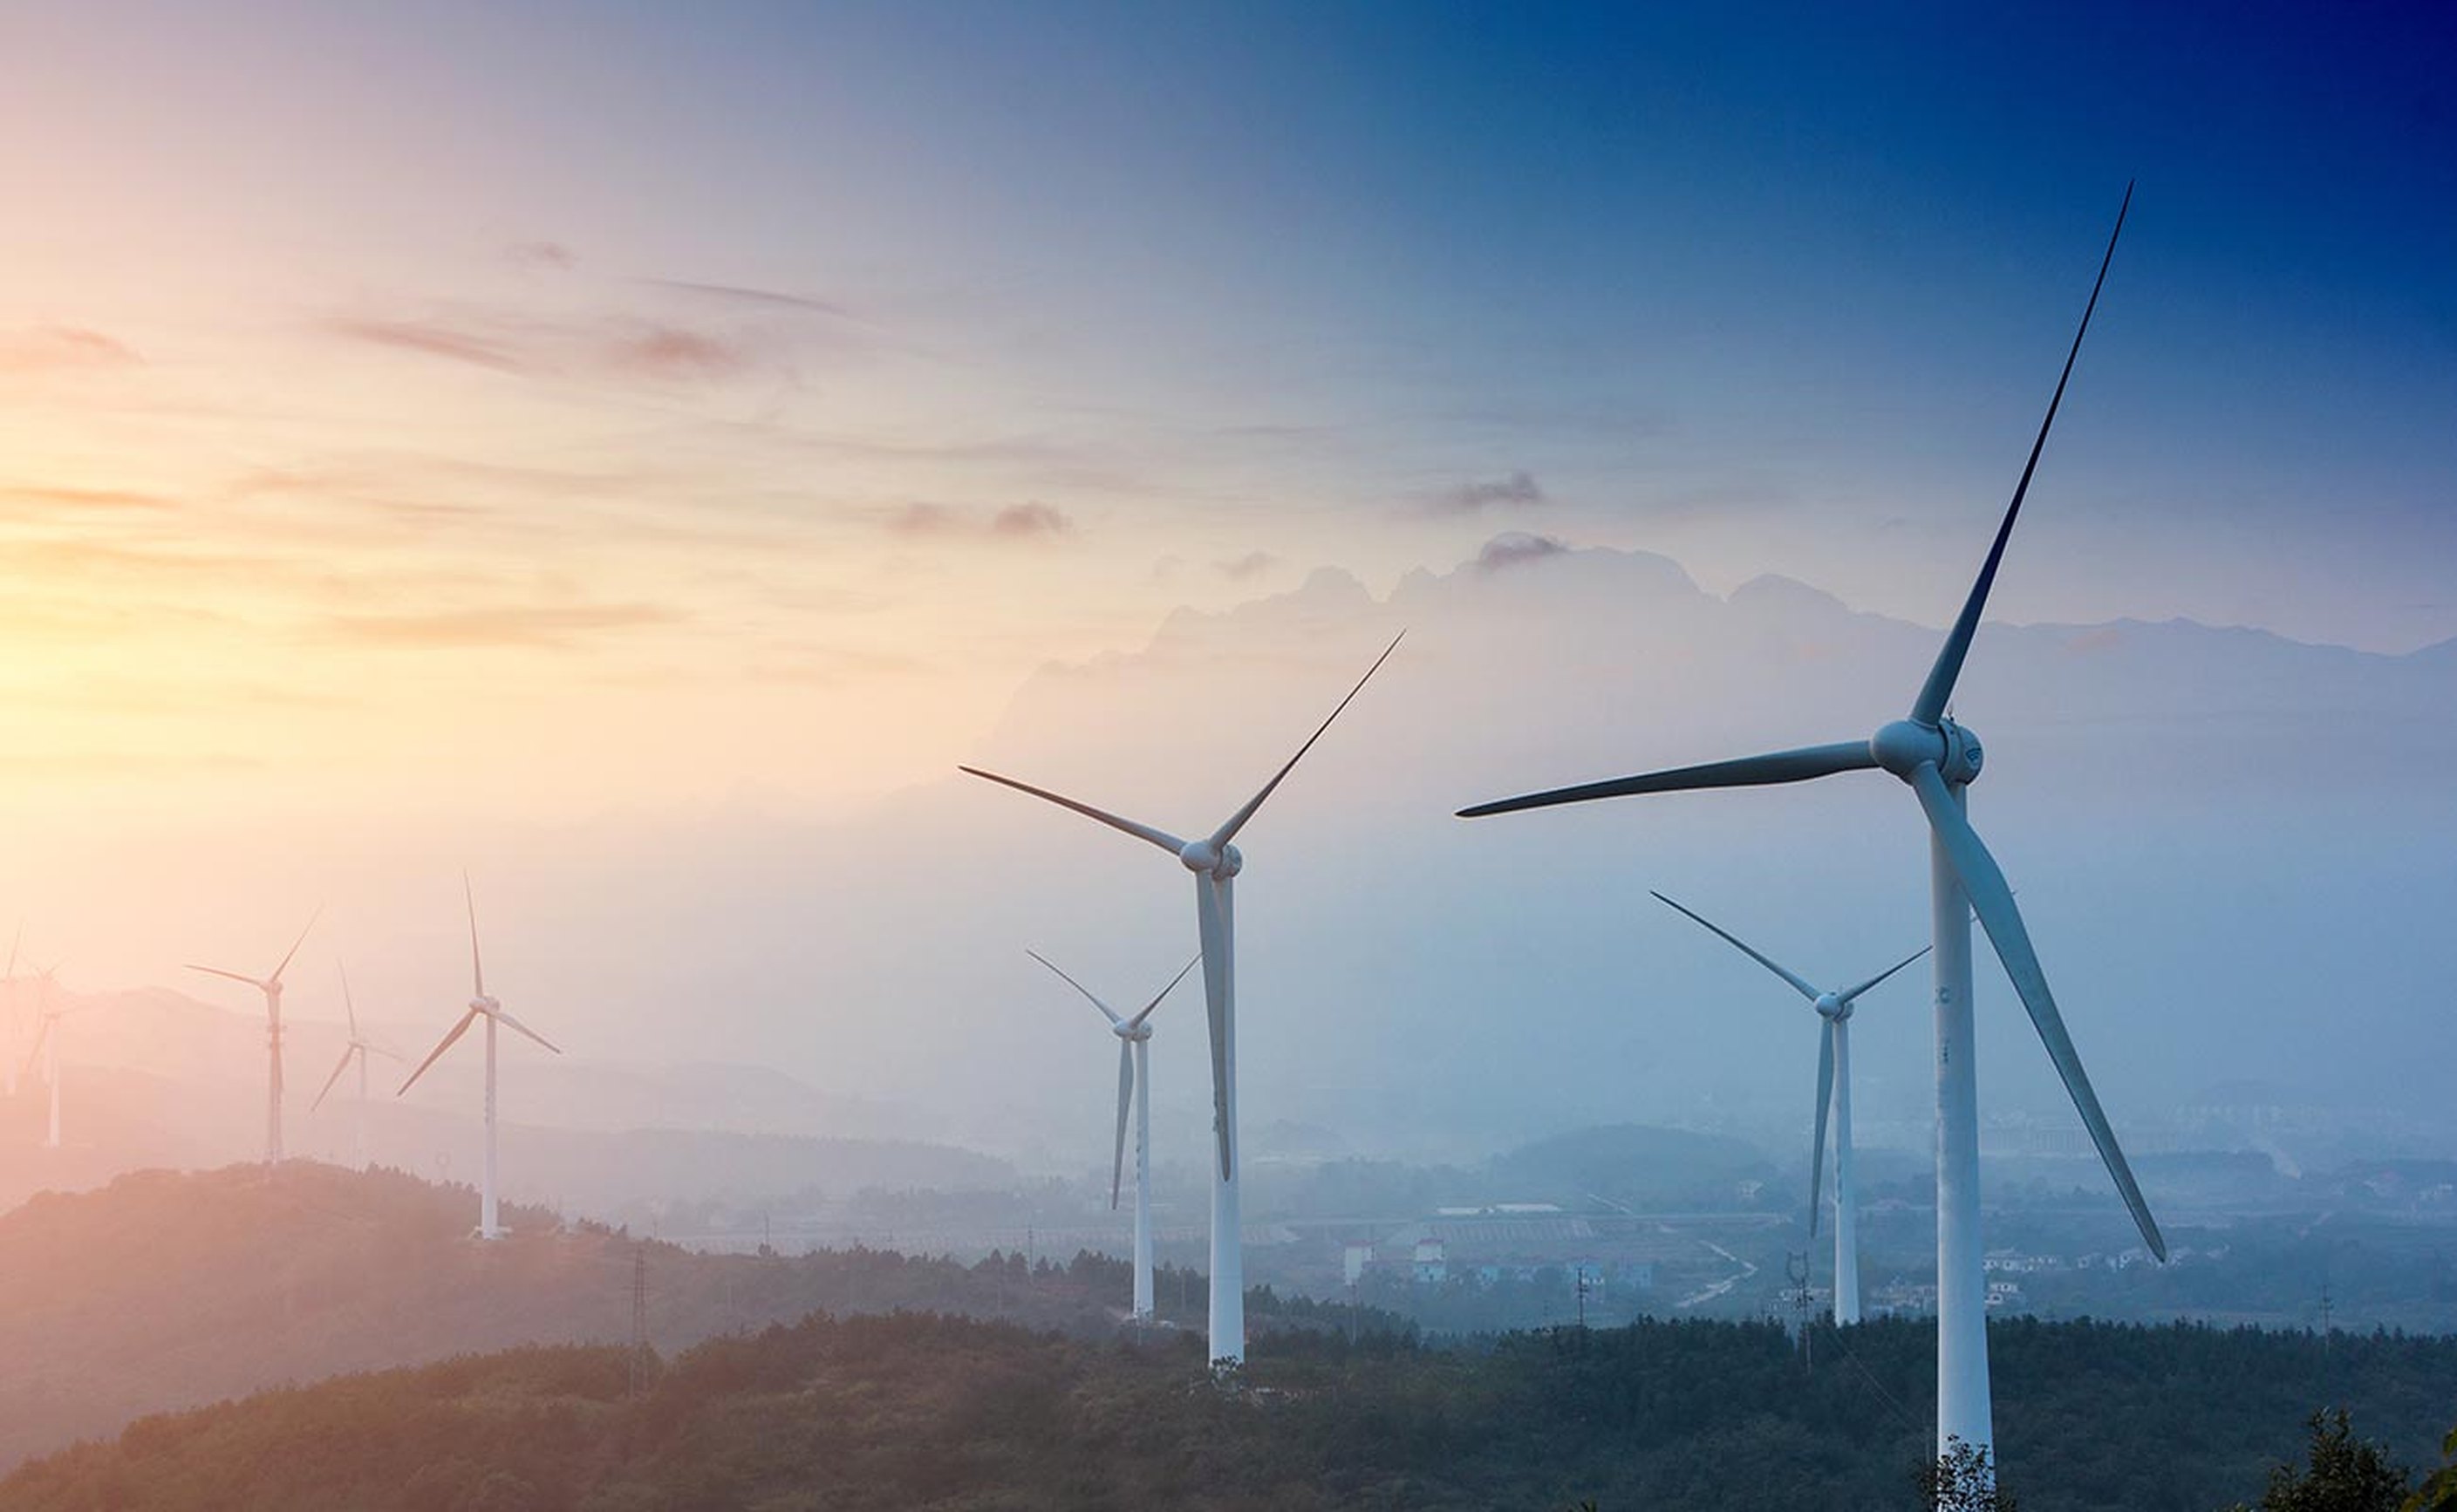
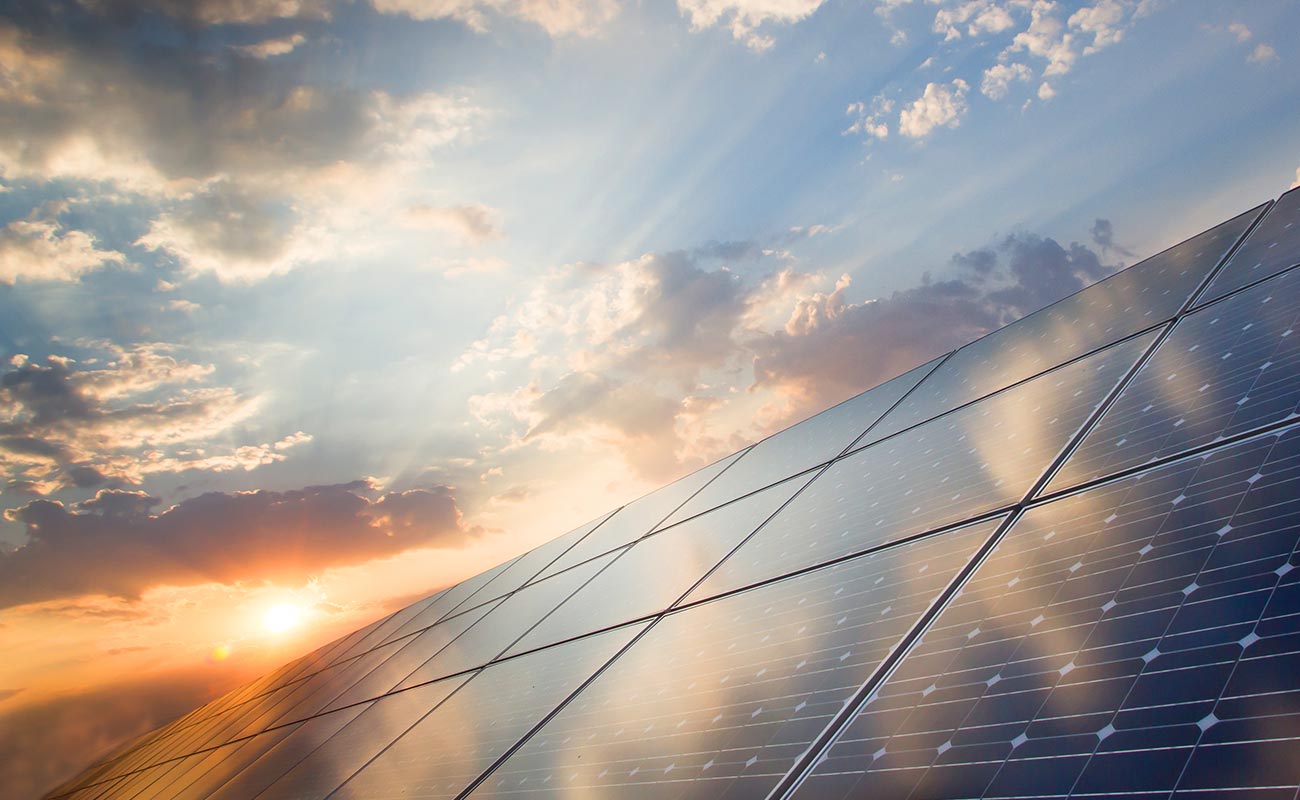
Energy Division
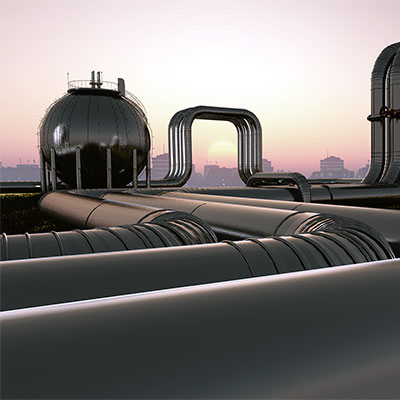
Energy ForFour Continents
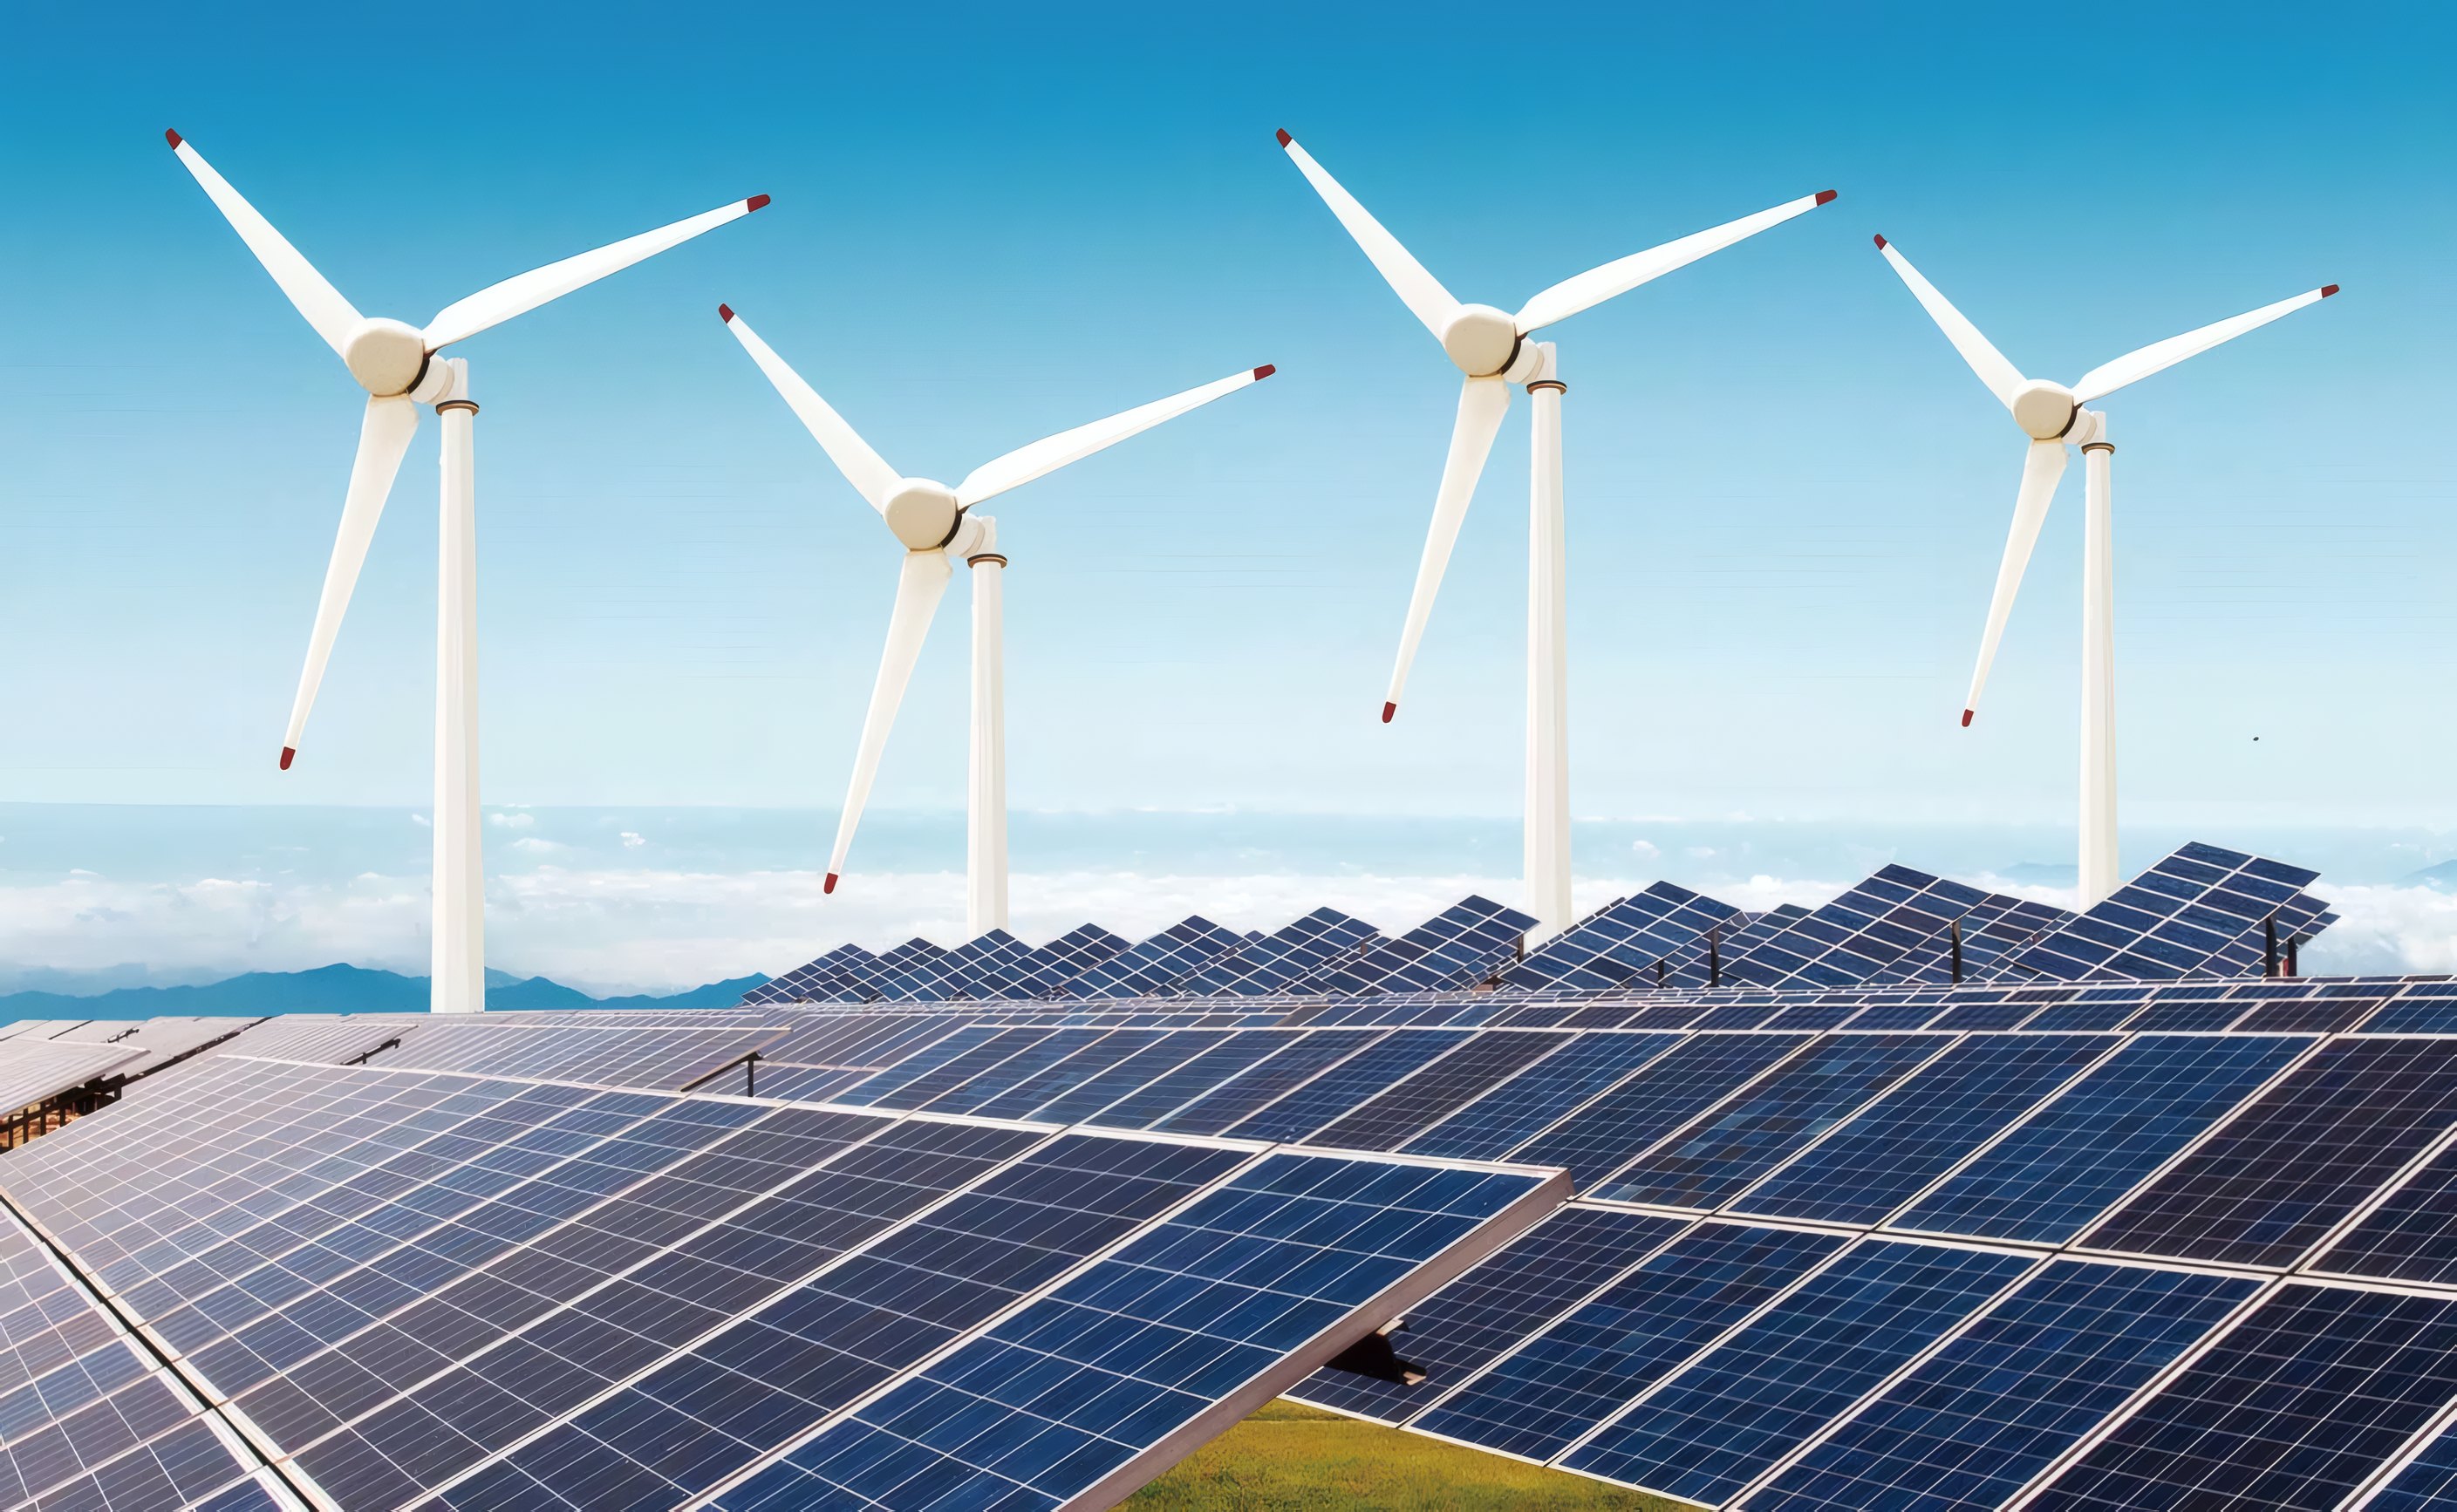
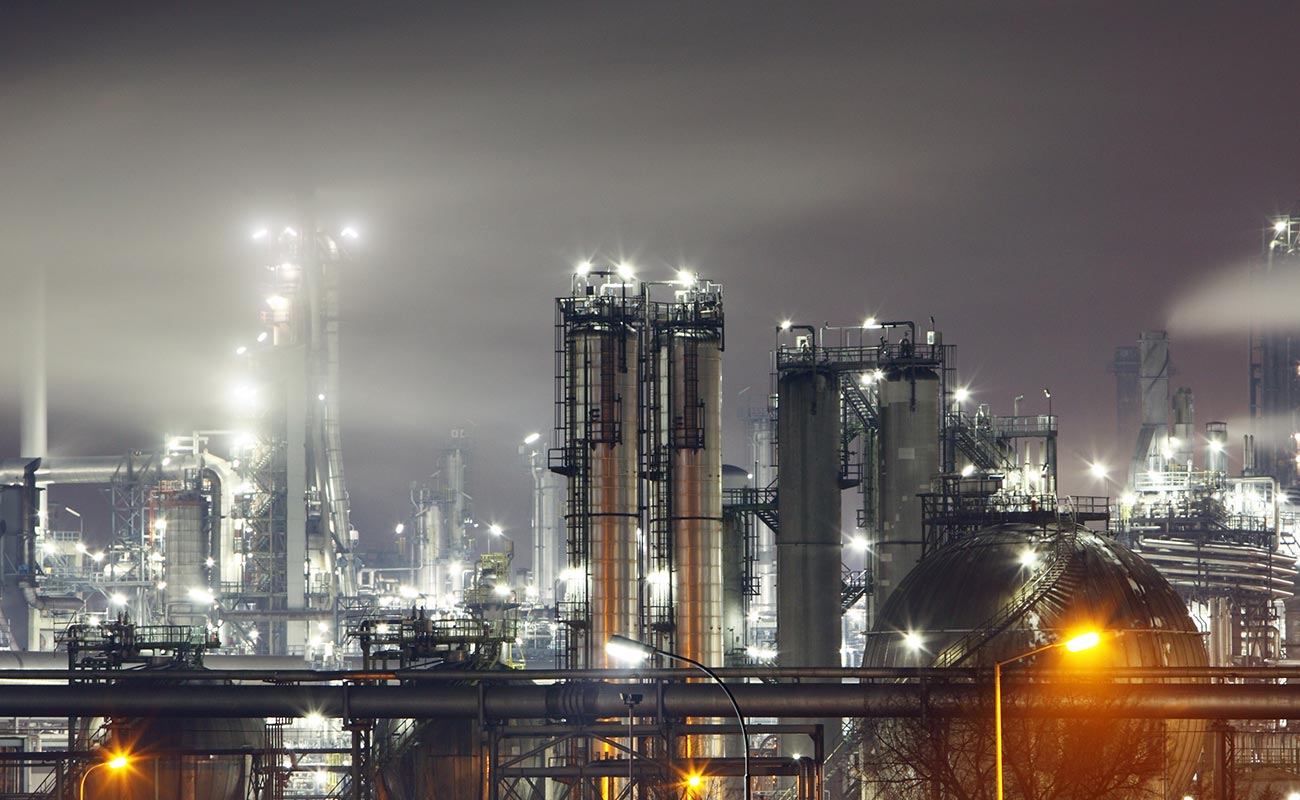
3.4 GW of wind and solar capacity, and a refinery that cut its emissions by a fifth.
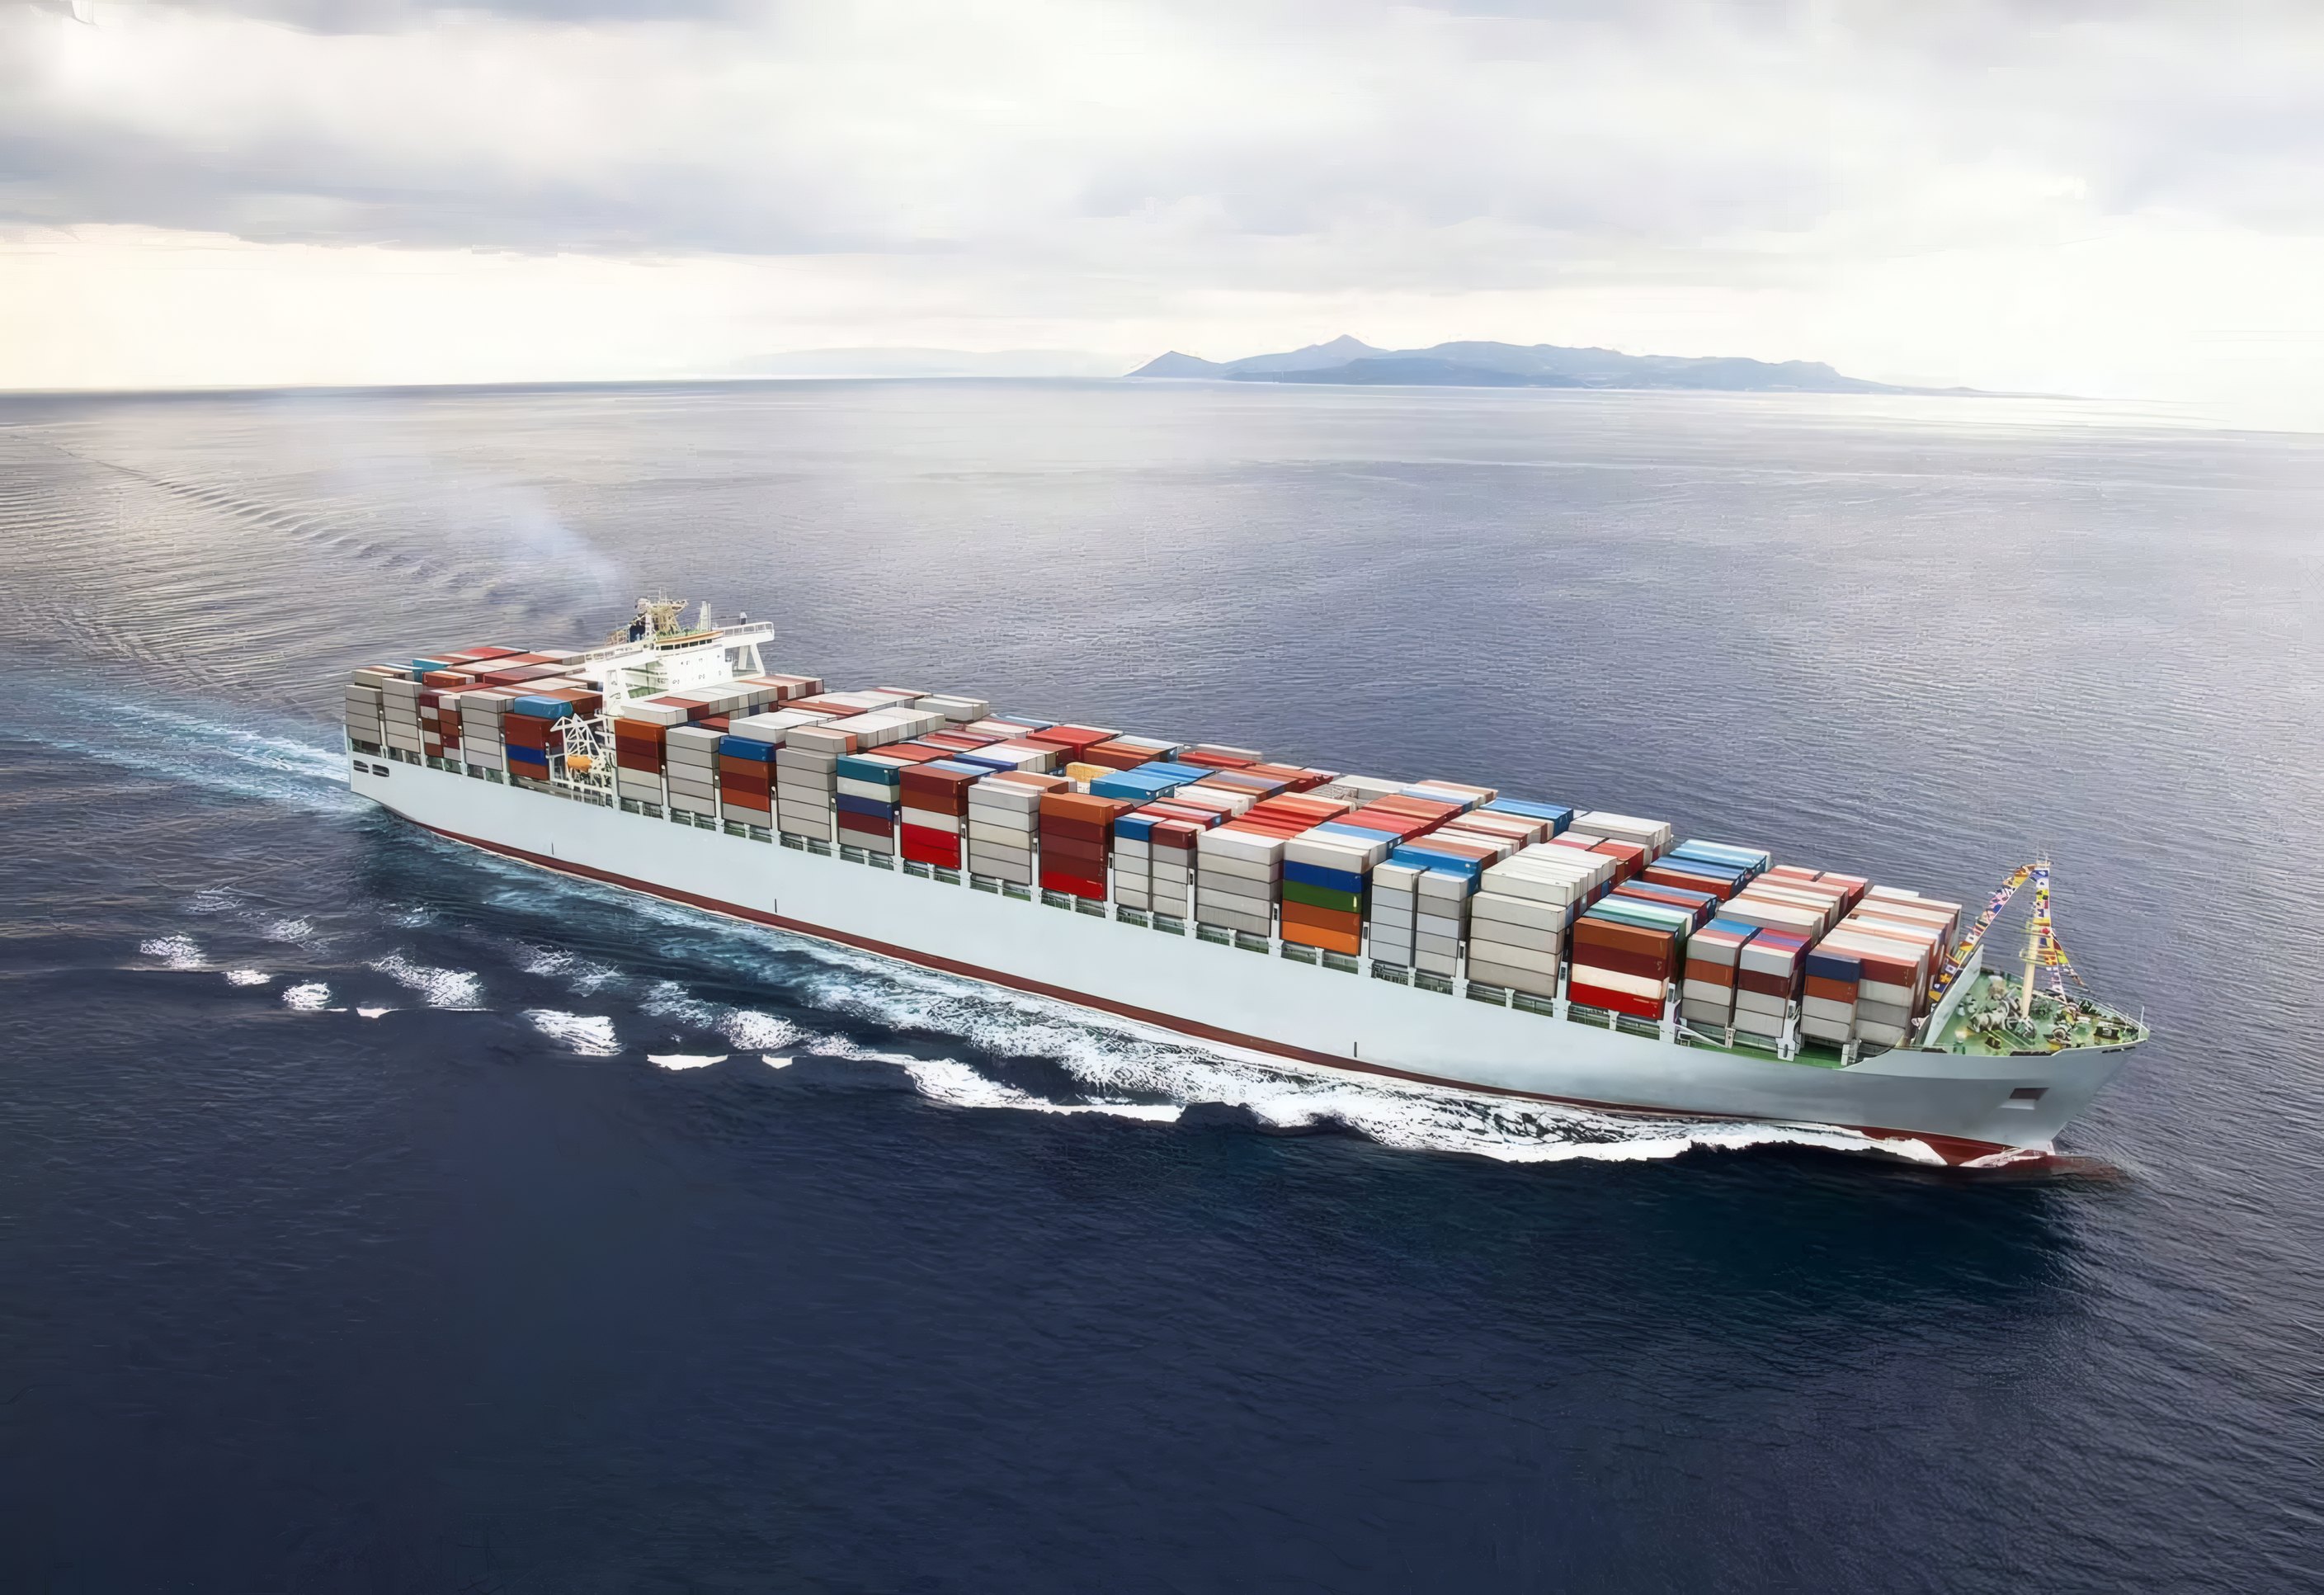
Logistics Division
Moving The GoodsThe World Needs
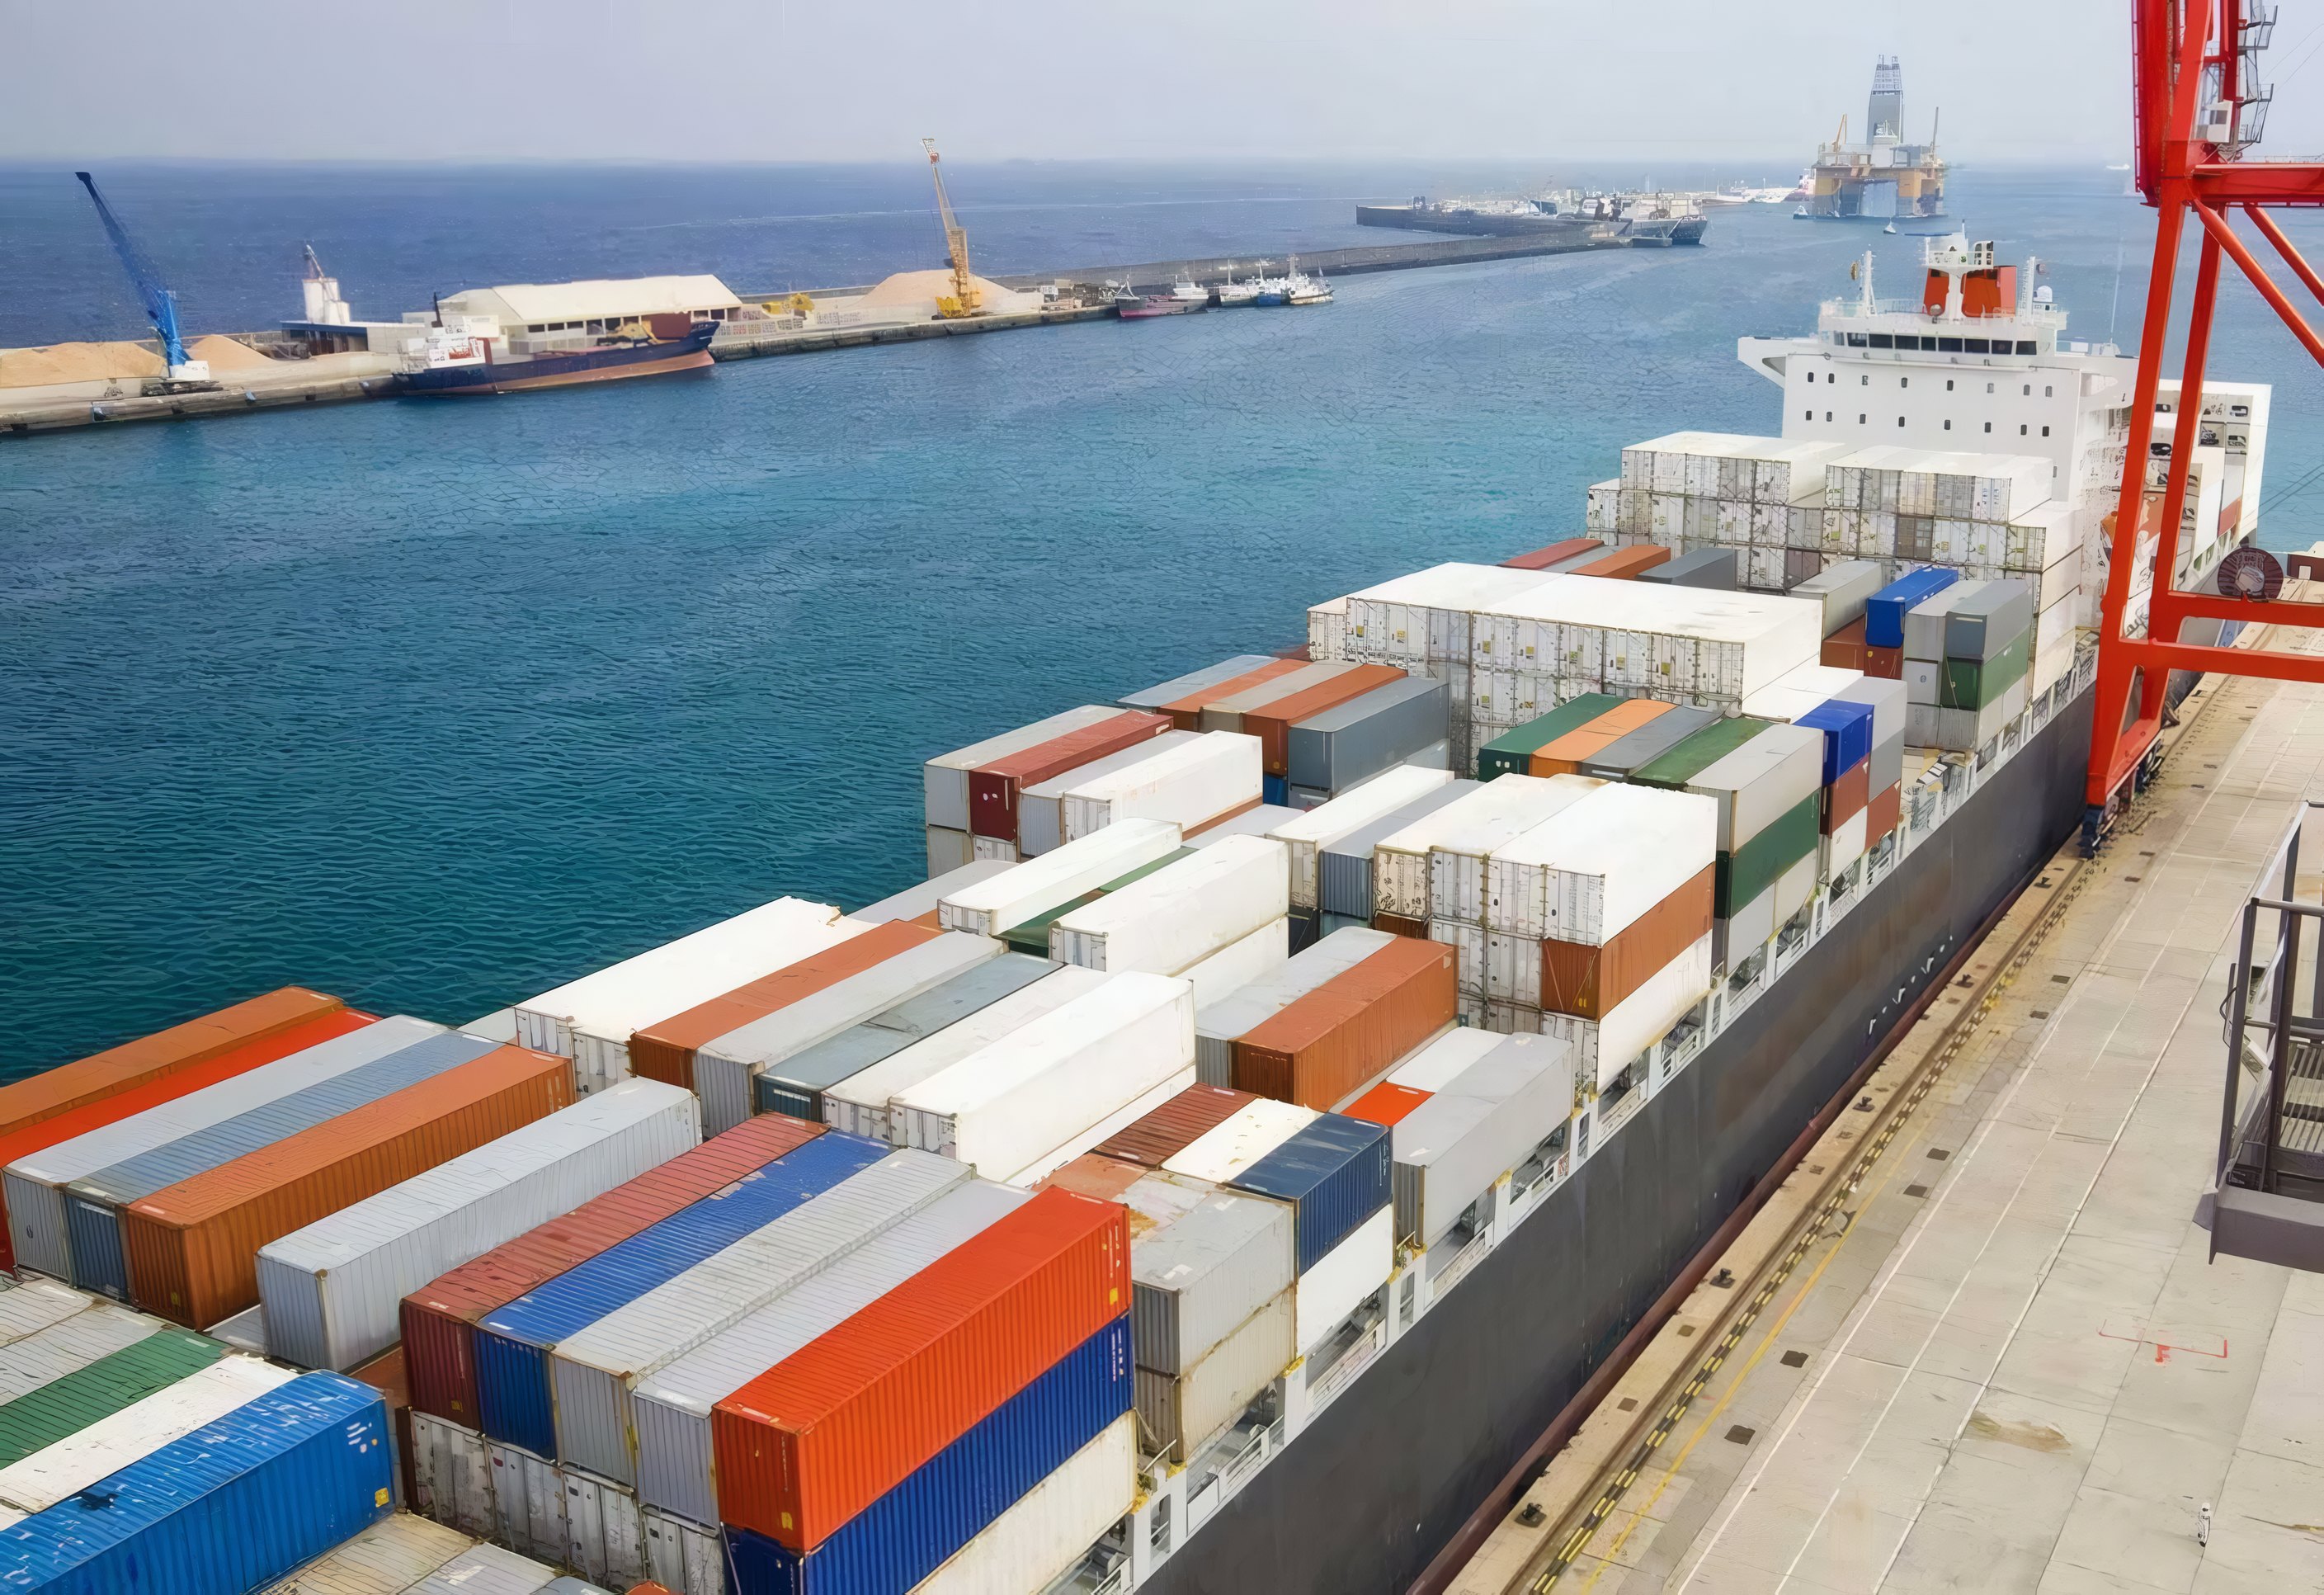
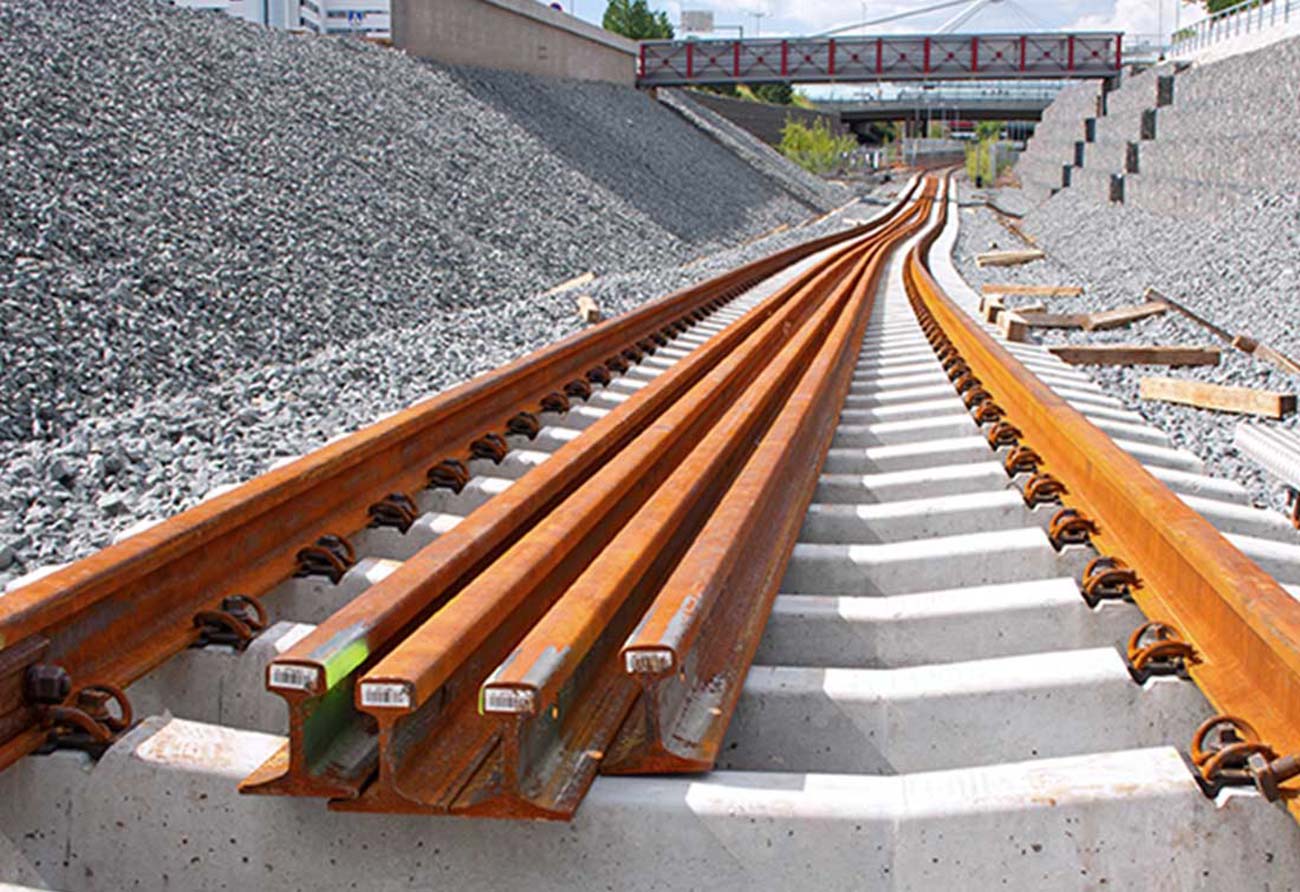
Ports, rail and road freight in eighteen countries: 1.9 million containers moved last year.
01 / 03
Our Four Divisions

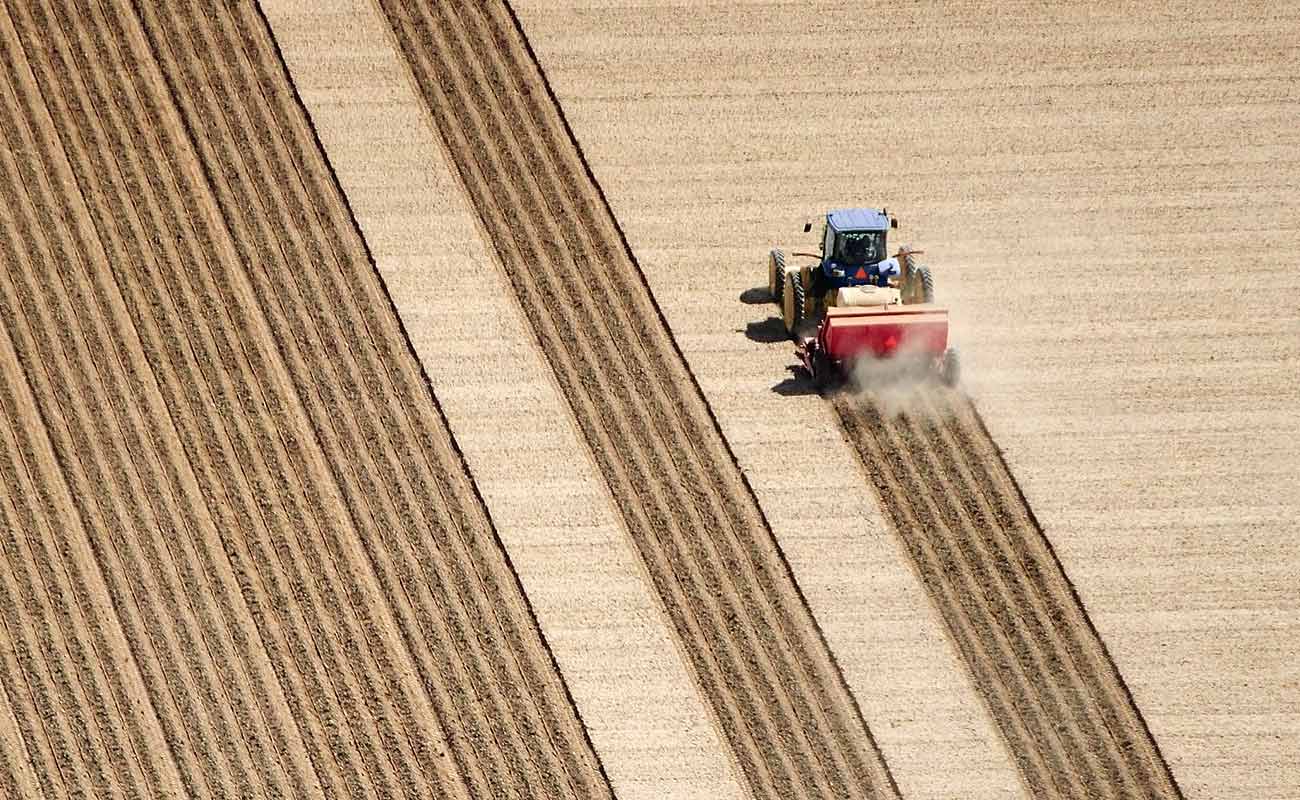
Agriculture In 2025
- Revenue$3.1bn
- EBITDA Margin14.2%
- People4,200
- Sites38
- Grain Handled6.8 Mt
Seed, Grain And Farm Machinery
Lorem ipsum dolor sit amet, consectetur adipiscing elit. Units: Seed & Grain, Crop Care, Farm Machinery, Storage & Terminals.
Explore Agriculture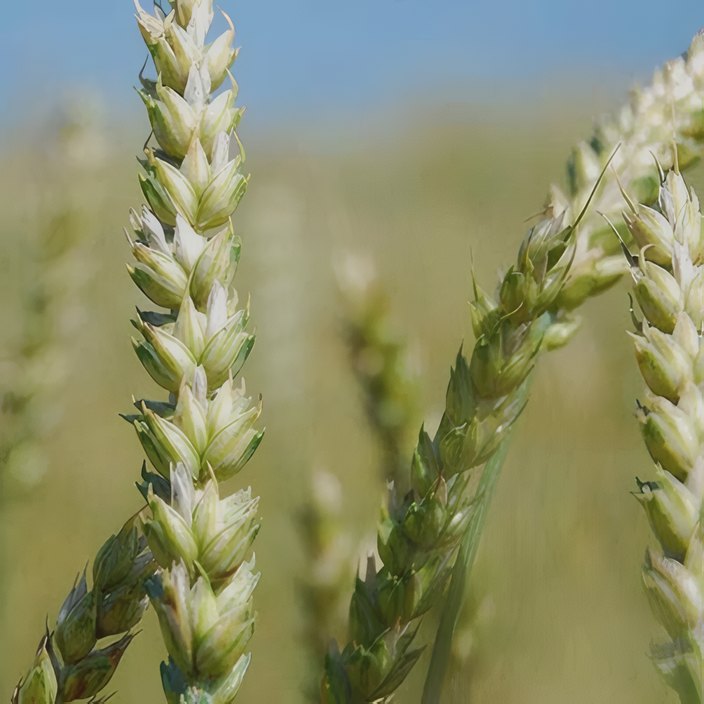 Revenue Growth6.9%24.6% of group revenue
Energy In 2025
- Revenue$4.2bn
- EBITDA Margin21.4%
- People3,600
- Sites21
- Installed Capacity3.4 GW
Wind, Solar And Cleaner Fuels
Lorem ipsum dolor sit amet, consectetur adipiscing elit. Units: Wind, Solar, Refining, Grid Services.
Explore Energy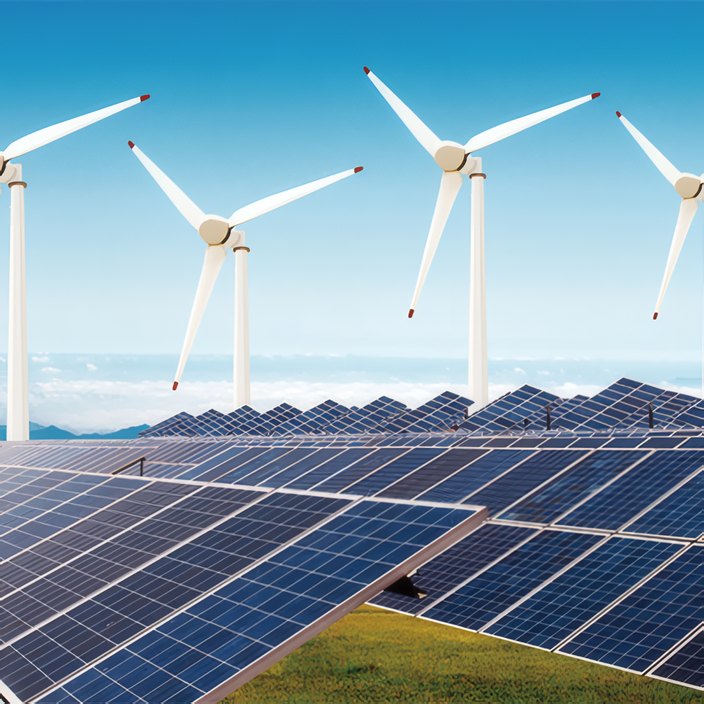 Revenue Growth5.0%33.3% of group revenue
Logistics In 2025
- Revenue$3.0bn
- EBITDA Margin12.0%
- People6,100
- Sites34
- Containers Moved1.9M TEU
Ports, Rail And Road Freight
Lorem ipsum dolor sit amet, consectetur adipiscing elit. Units: Port Terminals, Rail Freight, Road Haulage, Warehousing.
Explore Logistics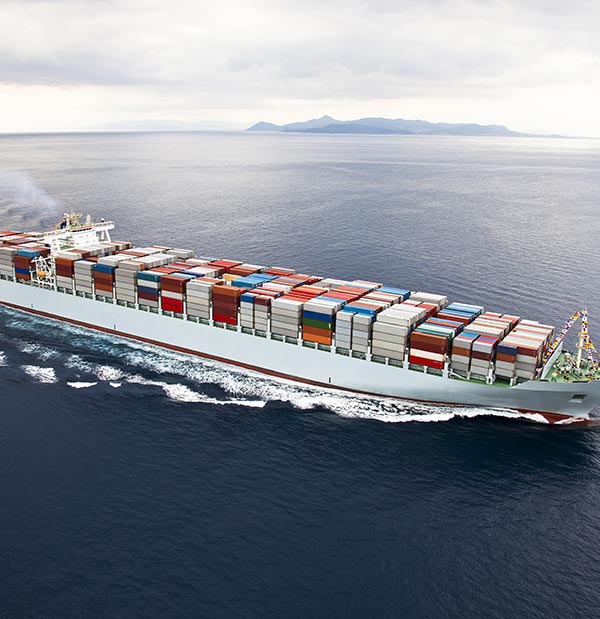 Revenue Growth3.4%23.8% of group revenue

Manufacturing In 2025
- Revenue$2.3bn
- EBITDA Margin16.5%
- People4,500
- Sites19
- Steel Fabricated412 kt
Fabrication, Machining And Components
Lorem ipsum dolor sit amet, consectetur adipiscing elit. Units: Fabrication, Precision Machining, Components, Coatings.
Explore Manufacturing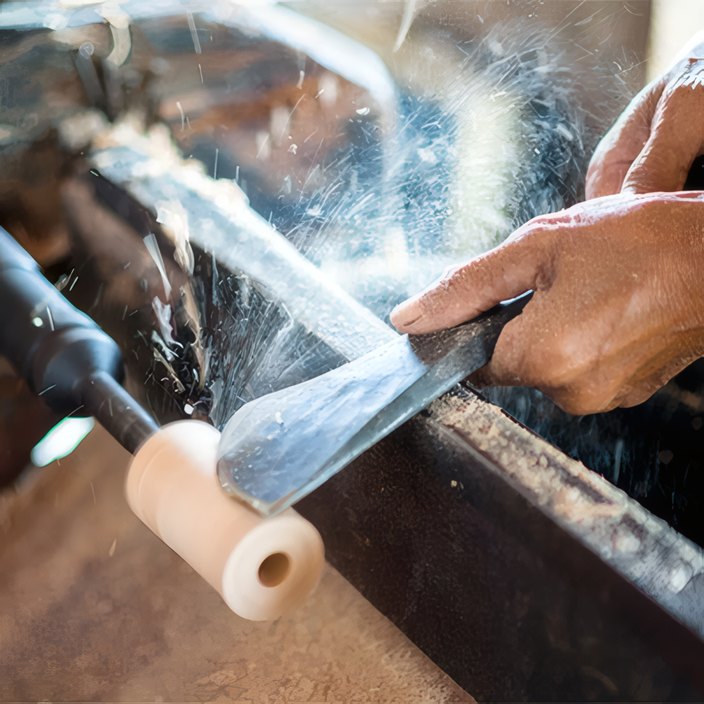 Revenue Growth4.5%18.3% of group revenue
How The Group Works
Owners, Not Traders
We buy good businesses, invest in their plants and keep them. Four steps, repeated for sixty years.
-
1.
Own For The Long Run
Lorem ipsum is simply dummy text ofer thetonat sunrising printing and typesetting industry.
-
 2.
Invest In The Plants
Lorem ipsum is simply dummy text ofer thetonat sunrising printing and typesetting industry.
-
3.
Run Modern Machines
Lorem ipsum is simply dummy text ofer thetonat sunrising printing and typesetting industry.
-
 4.
Return Cash To Owners
Lorem ipsum is simply dummy text ofer thetonat sunrising printing and typesetting industry.
The Group In Figures

 18,400People In Four Divisions

 24Countries

 112Plants, Terminals & Parks

 1962Founded In Chicago
Statistical Indicator
Compare Divisions
One Group, Four Engines
No single market carries the group. Watch the year's revenue split into the four divisions that earned it.
Group Revenue 2025
$12.6bn
5.0%
- Agriculture $3.1bn24.6% of group 6.9%
- Energy $4.2bn33.3% of group 5.0%
- Logistics $3.0bn23.8% of group 3.4%
- Manufacturing $2.3bn18.3% of group 4.5%
Voices From Our Sites
The People Who Run It
“Steel You Can Trust”
We can bring positive energy into our daily lives by smiling more, talking to strangers in line, and calling our friends just to tell them we love them.
 Diego AlvarezPlant Manager, Monterrey
“Every Turbine Counts”
We can bring positive energy into our daily lives by smiling more, talking to strangers in line, and calling our friends just to tell them we love them.
 Ben CarterWind Turbine Technician, Esbjerg
“The Rhine Never Sleeps”
We can bring positive energy into our daily lives by smiling more, talking to strangers in line, and calling our friends just to tell them we love them.
 Lena FischerProcess Engineer, Duisburg
“From Seed To Silo”
We can bring positive energy into our daily lives by smiling more, talking to strangers in line, and calling our friends just to tell them we love them.
 Aaron WebbGraduate Engineer, Lincoln
Latest Results
The Year In Numbers
Revenue, earnings and the dividend for each full year, against the year before.
- Revenue$12.6bn 5.0%
- EBITDA$2.1bn 6.7%
- EBITDA Margin16.5%
- Earnings Per Share$3.52 6.7%
- Dividend Per Share$1.52 8.6%
- Net Debt$3.6bn
- Revenue$12.0bn 3.4%
- EBITDA$1.9bn 4.8%
- EBITDA Margin16.2%
- Earnings Per Share$3.30 3.8%
- Dividend Per Share$1.40 7.7%
- Net Debt$3.9bn
- Revenue$11.6bn 6.4%
- EBITDA$1.9bn 10.7%
- EBITDA Margin16.0%
- Earnings Per Share$3.18 8.2%
- Dividend Per Share$1.30 8.3%
- Net Debt$4.2bn
Portfolio
Terminals, Farms, Parks And Plants

Work With The Group
Partnerships, supply contracts and investor meetings: tell us what you need and the right team answers.
Contact UsHow To Reach Us
Head Office
Stratora House
400 North Wacker Drive
Chicago, IL 60606






Get In Touch
Tell Us What You Need
Choose a subject and the right team answers within one working day.